Paper overview

Appendix A — Supporting Figures

The main text uses four core figures. The remaining supporting figures are retained for appendix, dissertation, presentation, or future paper use.

Figure 2

Construct Hierarchy

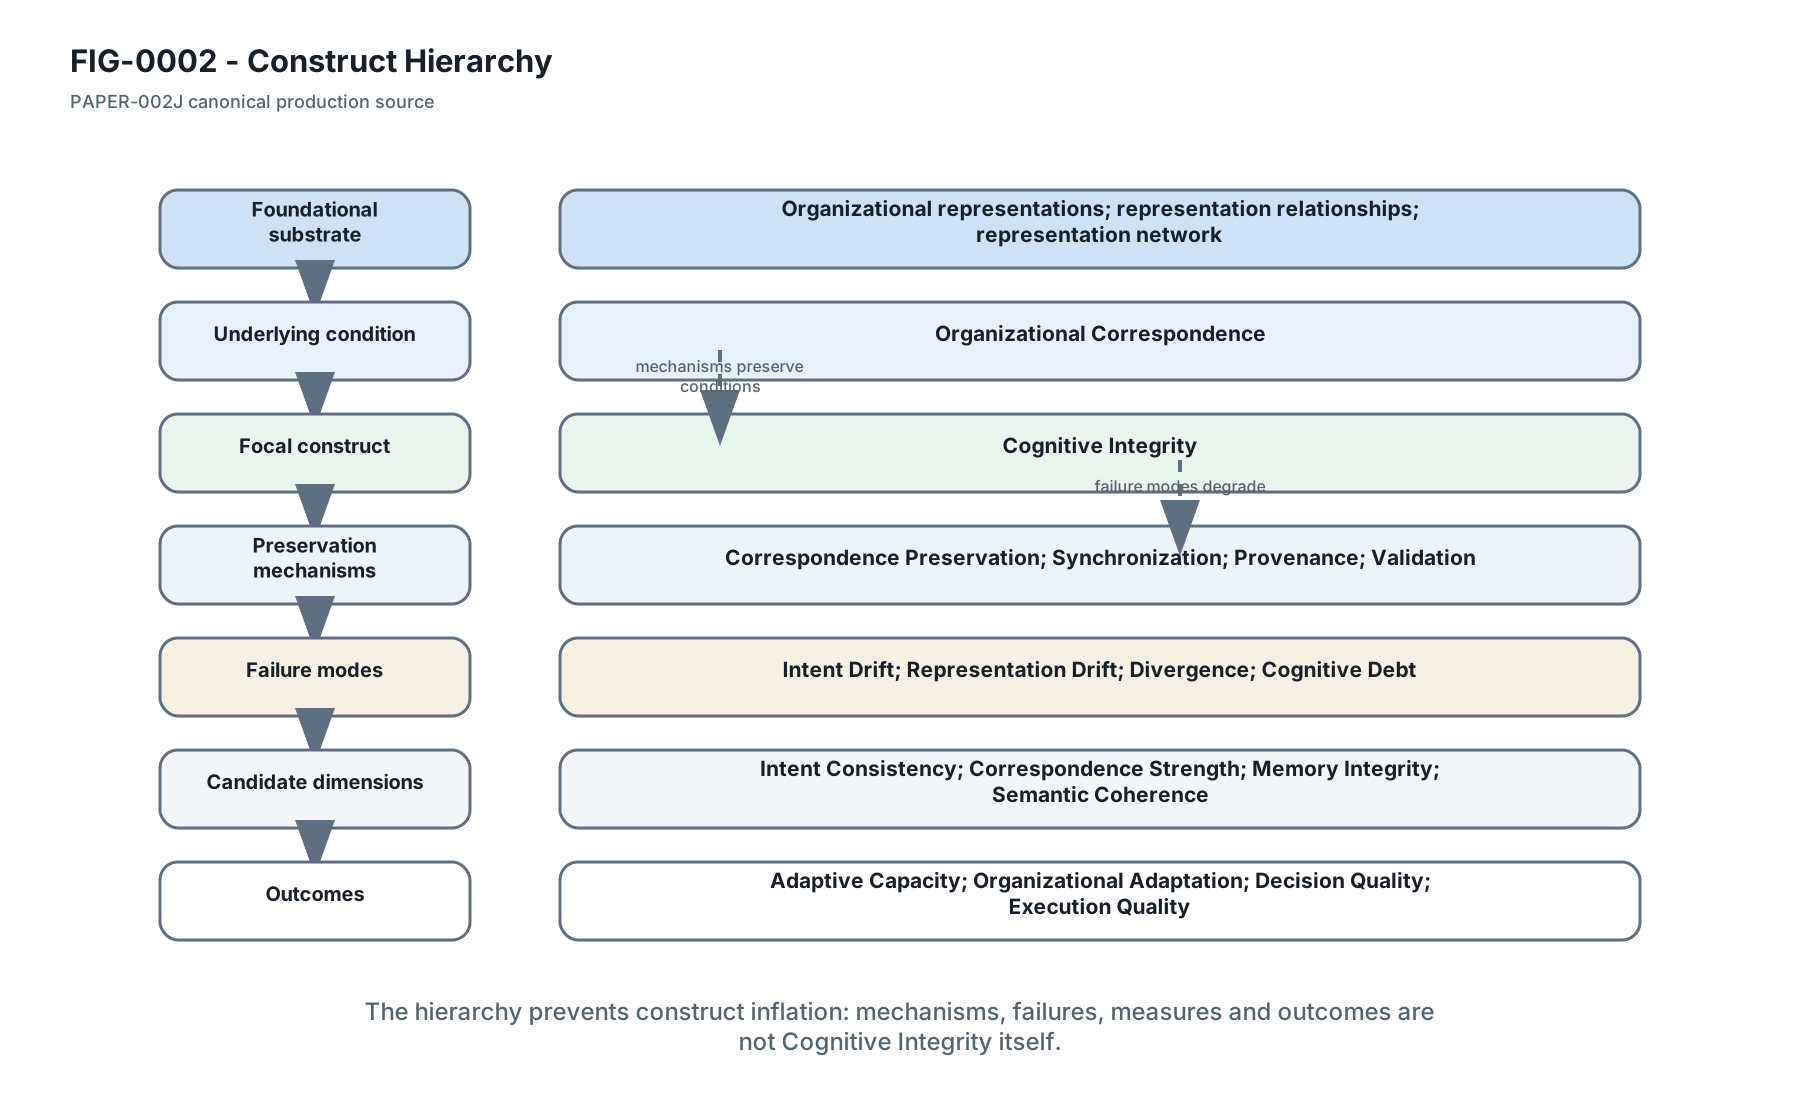
## Concise Alt Text Prevent construct inflation by showing theoretical hierarchy. ## Extended Description The figure titled "Construct Hierarchy" shows Representation network, Organizational Correspondence, Cognitive Integrity, Mechanisms, Failure modes, Dimensions, Outcomes. It uses labelled shapes and arrows to show: Mechanisms preserve conditions; failures degrade conditions; outcomes are downstream.. ## Reading Order 1. Read the title. 2. Read the primary construct or role groups from left to right or top to bottom. 3. Follow solid arrows as primary relationships. 4. Follow dashed arrows as feedback, boundary, moderation or secondary relationships. 5. Read the lower note as the interpretive boundary. ## Construct Descriptions - Representation network - Organizational Correspondence - Cognitive Integrity - Mechanisms - Failure modes - Dimensions - Outcomes ## Relationship Descriptions - Mechanisms preserve conditions; failures degrade conditions; outcomes are downstream. ## Encoding Limitations Color is supportive only. Meaning is preserved by labels, line styles, grouping, shape boundaries, captions and this accessibility description.
Figure 2 - Construct Hierarchy. Figure 2 distinguishes the representation-network substrate, Organizational Correspondence, Cognitive Integrity, preservation mechanisms, failure modes, candidate dimensions and outcomes.

Figure 4

Preservation Mechanisms

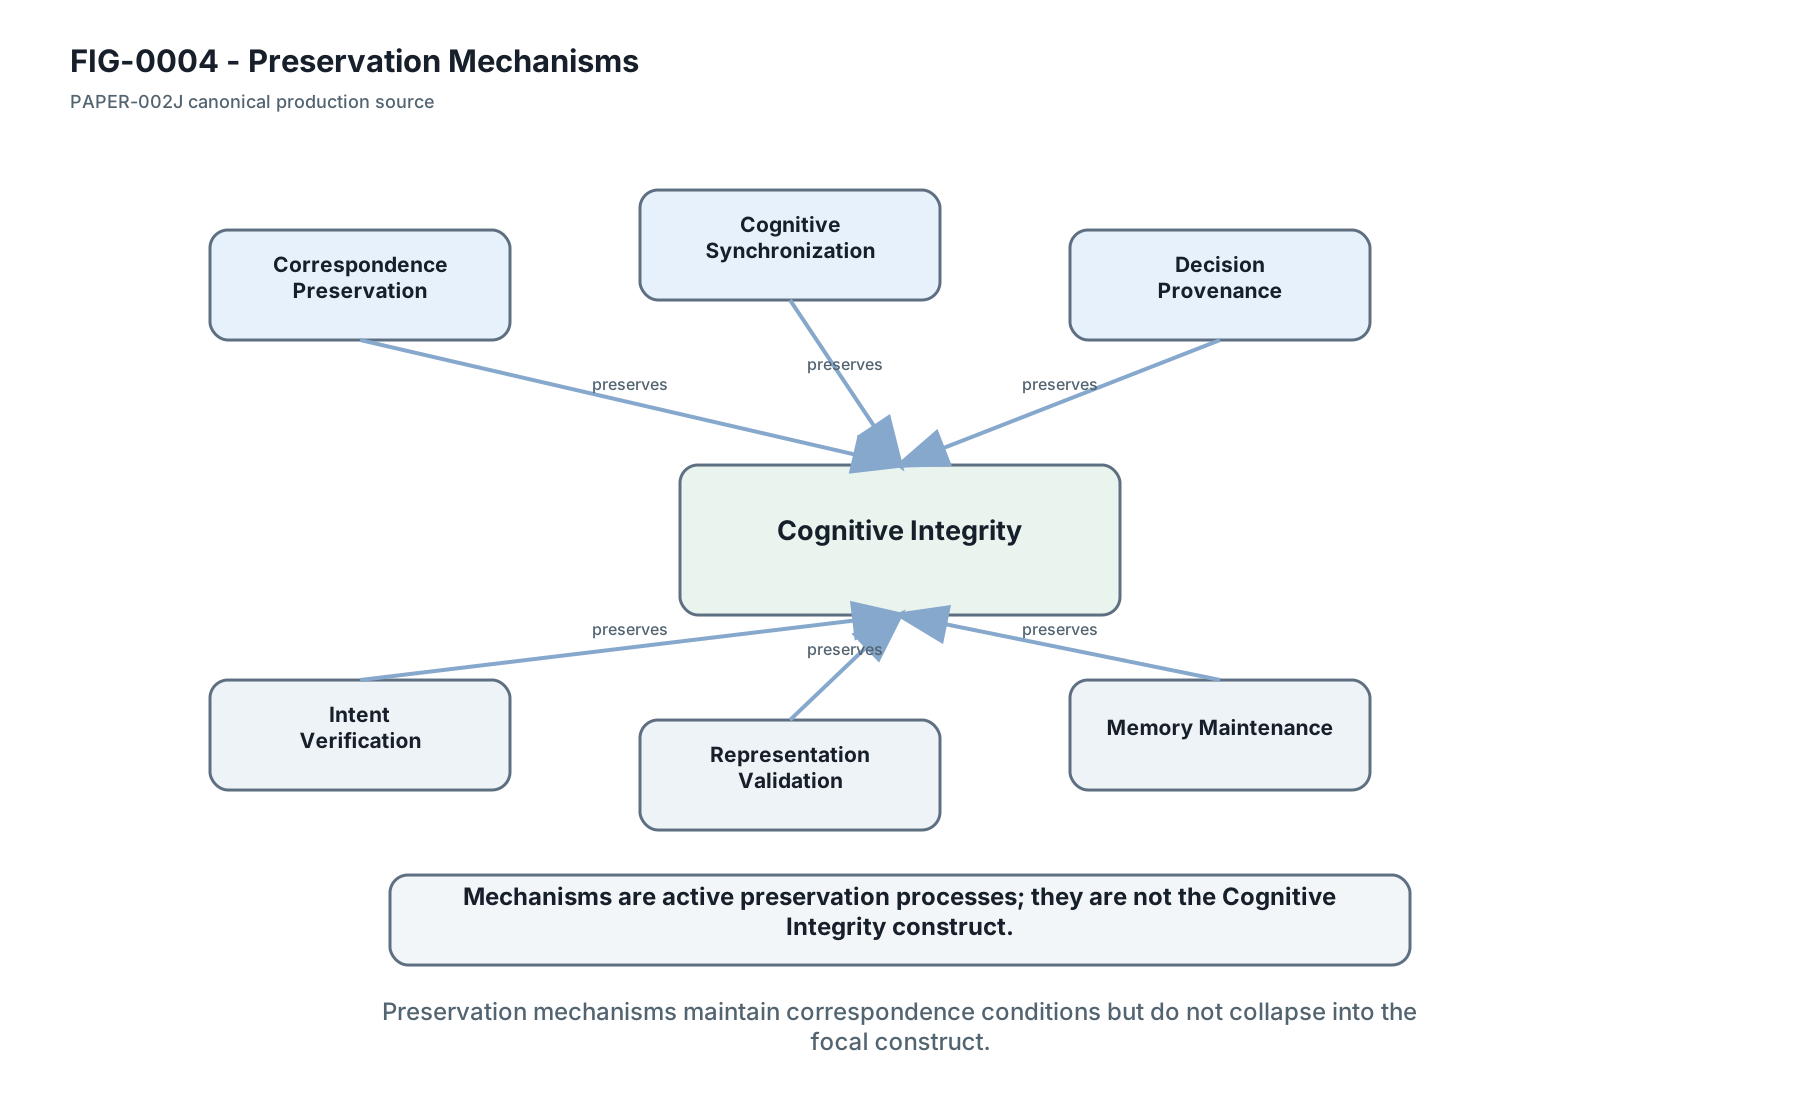
## Concise Alt Text Show active preservation mechanisms without treating them as the focal construct. ## Extended Description The figure titled "Preservation Mechanisms" shows Correspondence Preservation, Cognitive Synchronization, Decision Provenance, Intent Verification, Representation Validation, Memory Maintenance, Cognitive Integrity. It uses labelled shapes and arrows to show: Mechanisms preserve conditions from which Cognitive Integrity emerges.. ## Reading Order 1. Read the title. 2. Read the primary construct or role groups from left to right or top to bottom. 3. Follow solid arrows as primary relationships. 4. Follow dashed arrows as feedback, boundary, moderation or secondary relationships. 5. Read the lower note as the interpretive boundary. ## Construct Descriptions - Correspondence Preservation - Cognitive Synchronization - Decision Provenance - Intent Verification - Representation Validation - Memory Maintenance - Cognitive Integrity ## Relationship Descriptions - Mechanisms preserve conditions from which Cognitive Integrity emerges. ## Encoding Limitations Color is supportive only. Meaning is preserved by labels, line styles, grouping, shape boundaries, captions and this accessibility description.
Figure 4 - Preservation Mechanisms. Figure 4 shows the preservation mechanisms that sustain correspondence conditions: Correspondence Preservation, Cognitive Synchronization, Decision Provenance, Intent Verification, Representation Validation and Memory Maintenance.

Figure 5

Failure Mode Taxonomy

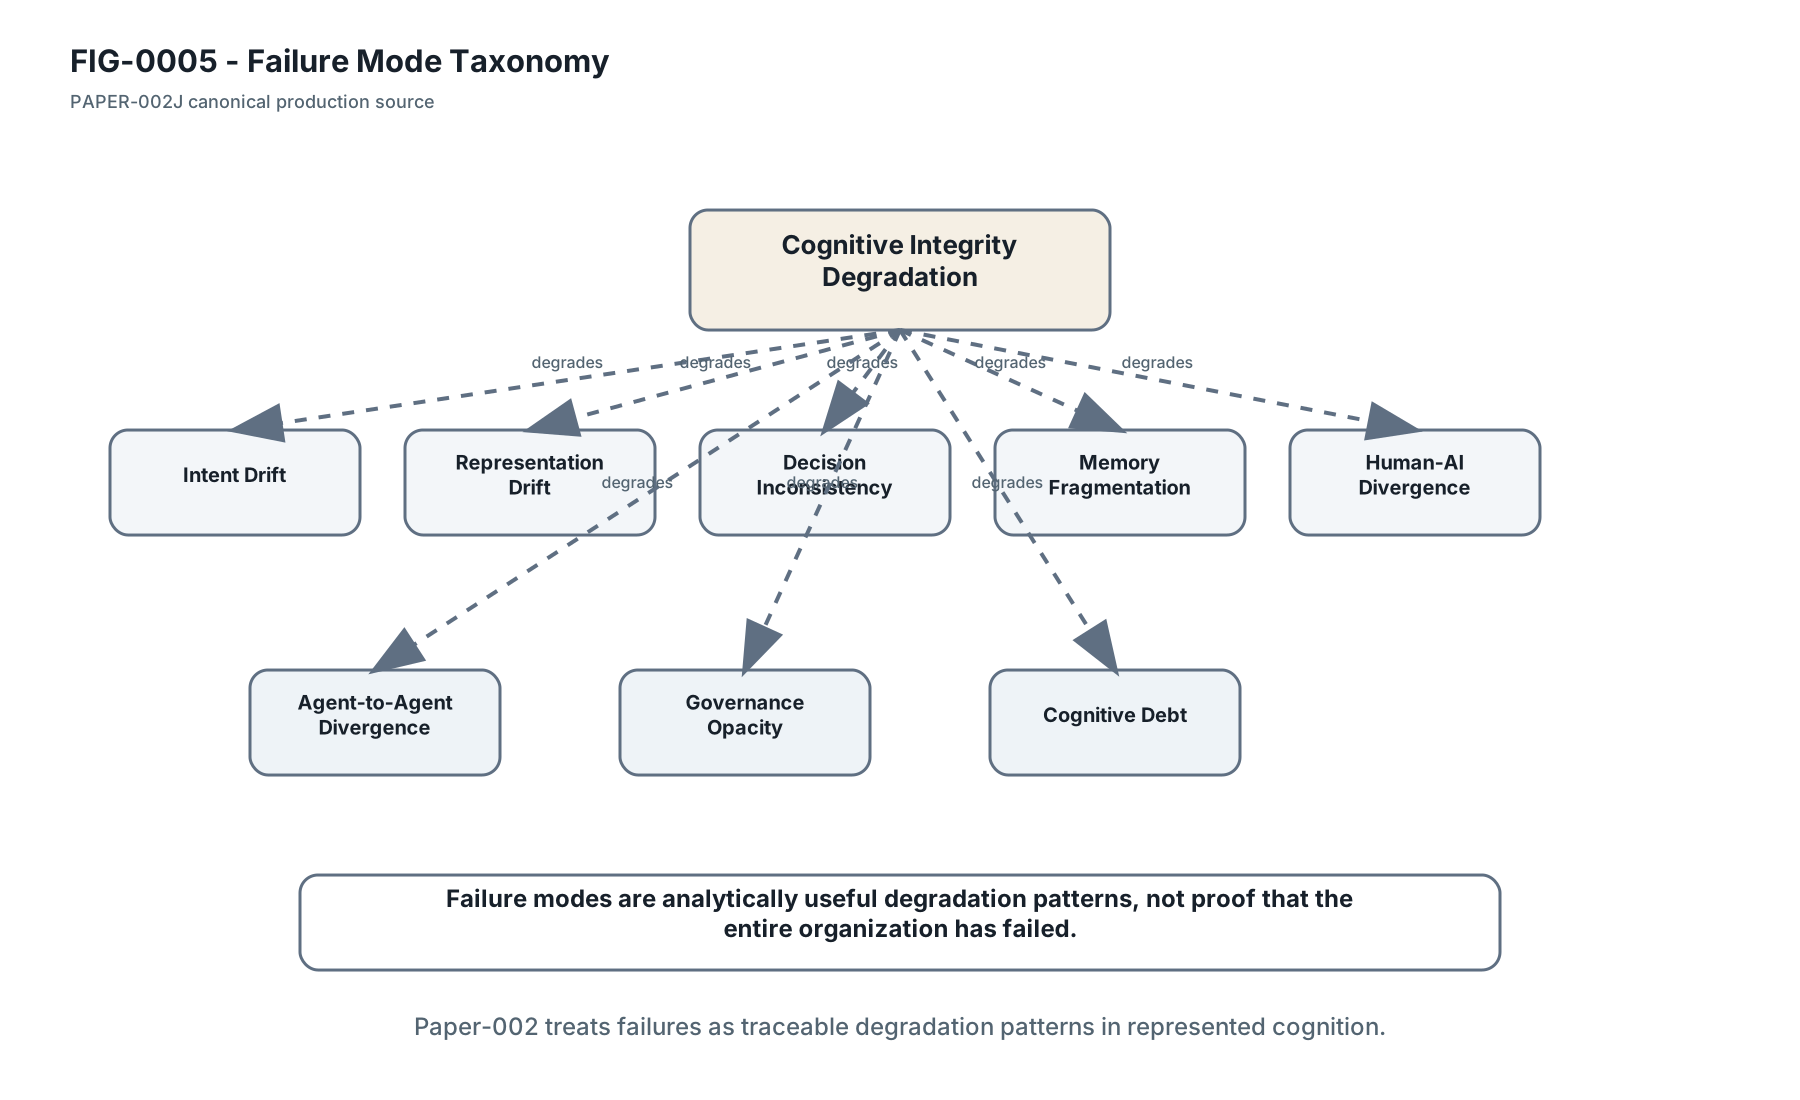
## Concise Alt Text Show degradation patterns traceable to manuscript failure modes. ## Extended Description The figure titled "Failure Mode Taxonomy" shows Intent Drift, Representation Drift, Decision Inconsistency, Memory Fragmentation, Human-AI Divergence, Agent-to-Agent Divergence, Governance Opacity, Cognitive Debt. It uses labelled shapes and arrows to show: Failure modes degrade Cognitive Integrity but do not prove total organizational failure.. ## Reading Order 1. Read the title. 2. Read the primary construct or role groups from left to right or top to bottom. 3. Follow solid arrows as primary relationships. 4. Follow dashed arrows as feedback, boundary, moderation or secondary relationships. 5. Read the lower note as the interpretive boundary. ## Construct Descriptions - Intent Drift - Representation Drift - Decision Inconsistency - Memory Fragmentation - Human-AI Divergence - Agent-to-Agent Divergence - Governance Opacity - Cognitive Debt ## Relationship Descriptions - Failure modes degrade Cognitive Integrity but do not prove total organizational failure. ## Encoding Limitations Color is supportive only. Meaning is preserved by labels, line styles, grouping, shape boundaries, captions and this accessibility description.
Figure 5 - Failure Mode Taxonomy. Figure 5 organizes failure modes through which Cognitive Integrity may degrade: Intent Drift, Representation Drift, Decision Inconsistency, Memory Fragmentation, Human-AI Divergence, Agent-to-Agent Divergence, Governance Opacity and Cognitive Debt.

Figure 6

Cognitive Integrity Lifecycle

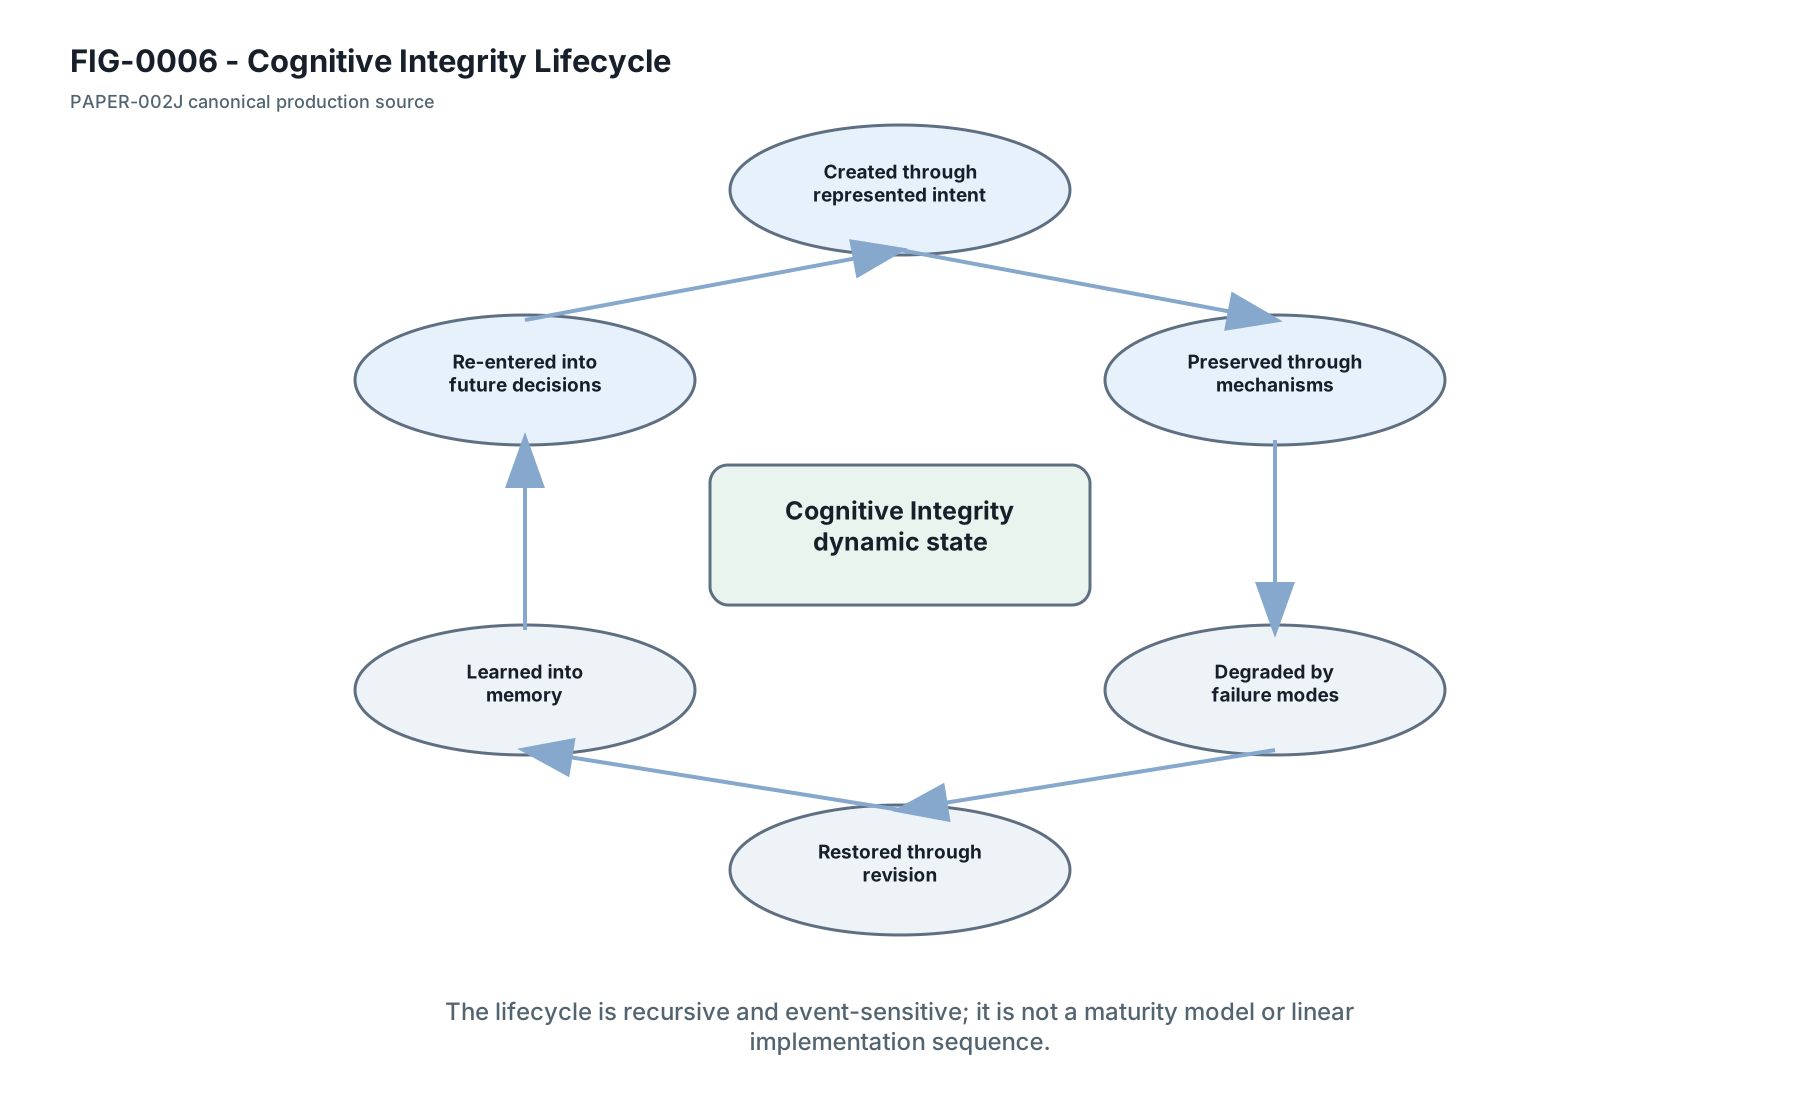
## Concise Alt Text Show lifecycle dynamics without creating a maturity model. ## Extended Description The figure titled "Cognitive Integrity Lifecycle" shows Creation, Preservation, Degradation, Restoration, Learning, Future decisions, Cognitive Integrity. It uses labelled shapes and arrows to show: Lifecycle activity is recursive and event-sensitive.. ## Reading Order 1. Read the title. 2. Read the primary construct or role groups from left to right or top to bottom. 3. Follow solid arrows as primary relationships. 4. Follow dashed arrows as feedback, boundary, moderation or secondary relationships. 5. Read the lower note as the interpretive boundary. ## Construct Descriptions - Creation - Preservation - Degradation - Restoration - Learning - Future decisions - Cognitive Integrity ## Relationship Descriptions - Lifecycle activity is recursive and event-sensitive. ## Encoding Limitations Color is supportive only. Meaning is preserved by labels, line styles, grouping, shape boundaries, captions and this accessibility description.
Figure 6 - Cognitive Integrity Lifecycle. Figure 6 represents Cognitive Integrity as a recursive dynamic state created, preserved, degraded, restored and learned into future organizational memory.

Figure 9

Diagnostic Framework

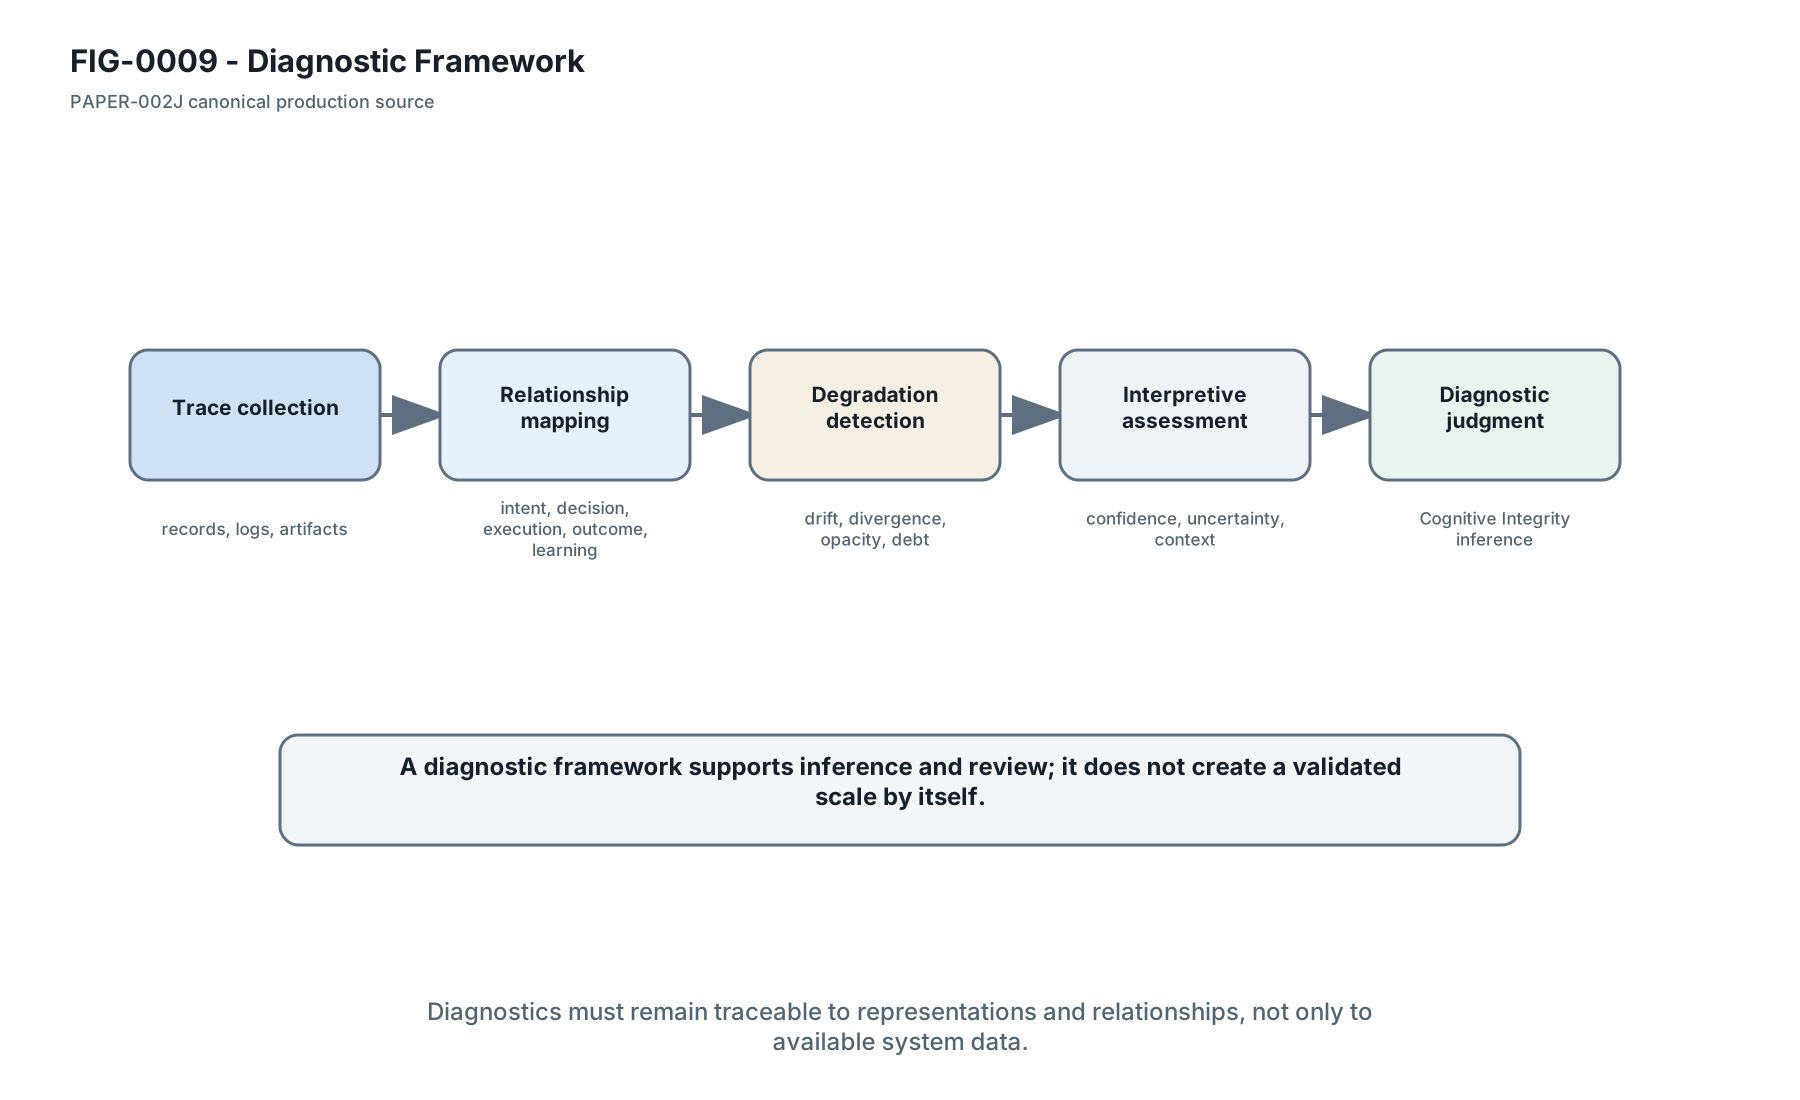
## Concise Alt Text Show diagnostic inference from trace evidence. ## Extended Description The figure titled "Diagnostic Framework" shows Trace collection, Relationship mapping, Degradation detection, Interpretive assessment, Diagnostic judgment. It uses labelled shapes and arrows to show: Diagnostics infer Cognitive Integrity from traceable representation relationships.. ## Reading Order 1. Read the title. 2. Read the primary construct or role groups from left to right or top to bottom. 3. Follow solid arrows as primary relationships. 4. Follow dashed arrows as feedback, boundary, moderation or secondary relationships. 5. Read the lower note as the interpretive boundary. ## Construct Descriptions - Trace collection - Relationship mapping - Degradation detection - Interpretive assessment - Diagnostic judgment ## Relationship Descriptions - Diagnostics infer Cognitive Integrity from traceable representation relationships. ## Encoding Limitations Color is supportive only. Meaning is preserved by labels, line styles, grouping, shape boundaries, captions and this accessibility description.
Figure 9 - Diagnostic Framework. Figure 9 shows a diagnostic pathway from trace collection and relationship mapping through degradation detection, interpretive assessment and diagnostic judgment.

Figure 10

Relationship Between Organizational Correspondence, Cognitive Integrity, Human Sustainability, and Organizational Adaptation

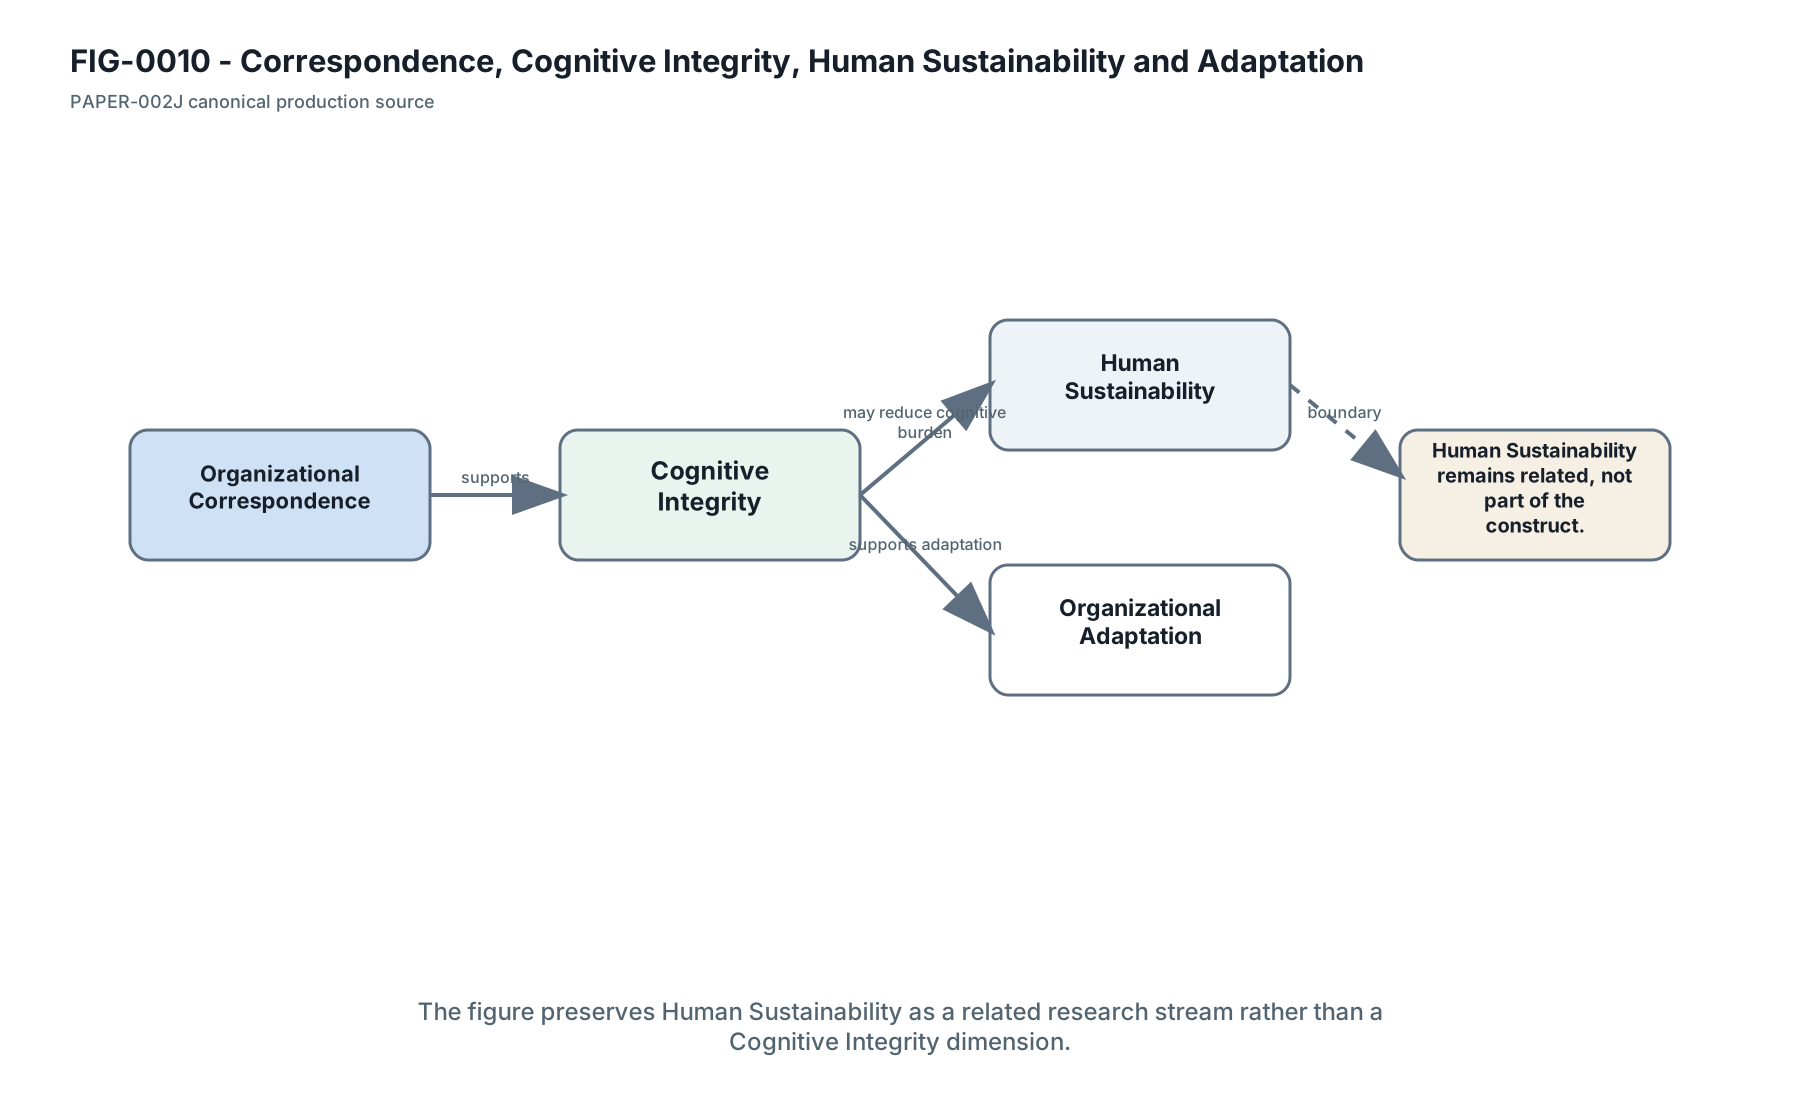
## Concise Alt Text Clarify the Human Sustainability boundary. ## Extended Description The figure titled "Relationship Between Organizational Correspondence, Cognitive Integrity, Human Sustainability, and Organizational Adaptation" shows Organizational Correspondence, Cognitive Integrity, Human Sustainability, Organizational Adaptation. It uses labelled shapes and arrows to show: Cognitive Integrity may reduce cognitive burden and support adaptation; Human Sustainability remains related but separate.. ## Reading Order 1. Read the title. 2. Read the primary construct or role groups from left to right or top to bottom. 3. Follow solid arrows as primary relationships. 4. Follow dashed arrows as feedback, boundary, moderation or secondary relationships. 5. Read the lower note as the interpretive boundary. ## Construct Descriptions - Organizational Correspondence - Cognitive Integrity - Human Sustainability - Organizational Adaptation ## Relationship Descriptions - Cognitive Integrity may reduce cognitive burden and support adaptation; Human Sustainability remains related but separate. ## Encoding Limitations Color is supportive only. Meaning is preserved by labels, line styles, grouping, shape boundaries, captions and this accessibility description.
Figure 10 - Relationship Between Organizational Correspondence, Cognitive Integrity, Human Sustainability, and Organizational Adaptation. Figure 10 relates Organizational Correspondence, Cognitive Integrity, Human Sustainability and Organizational Adaptation while preserving Human Sustainability as a related research stream rather than a component of Cognitive Integrity.

Figure 11

Future Empirical Research Agenda

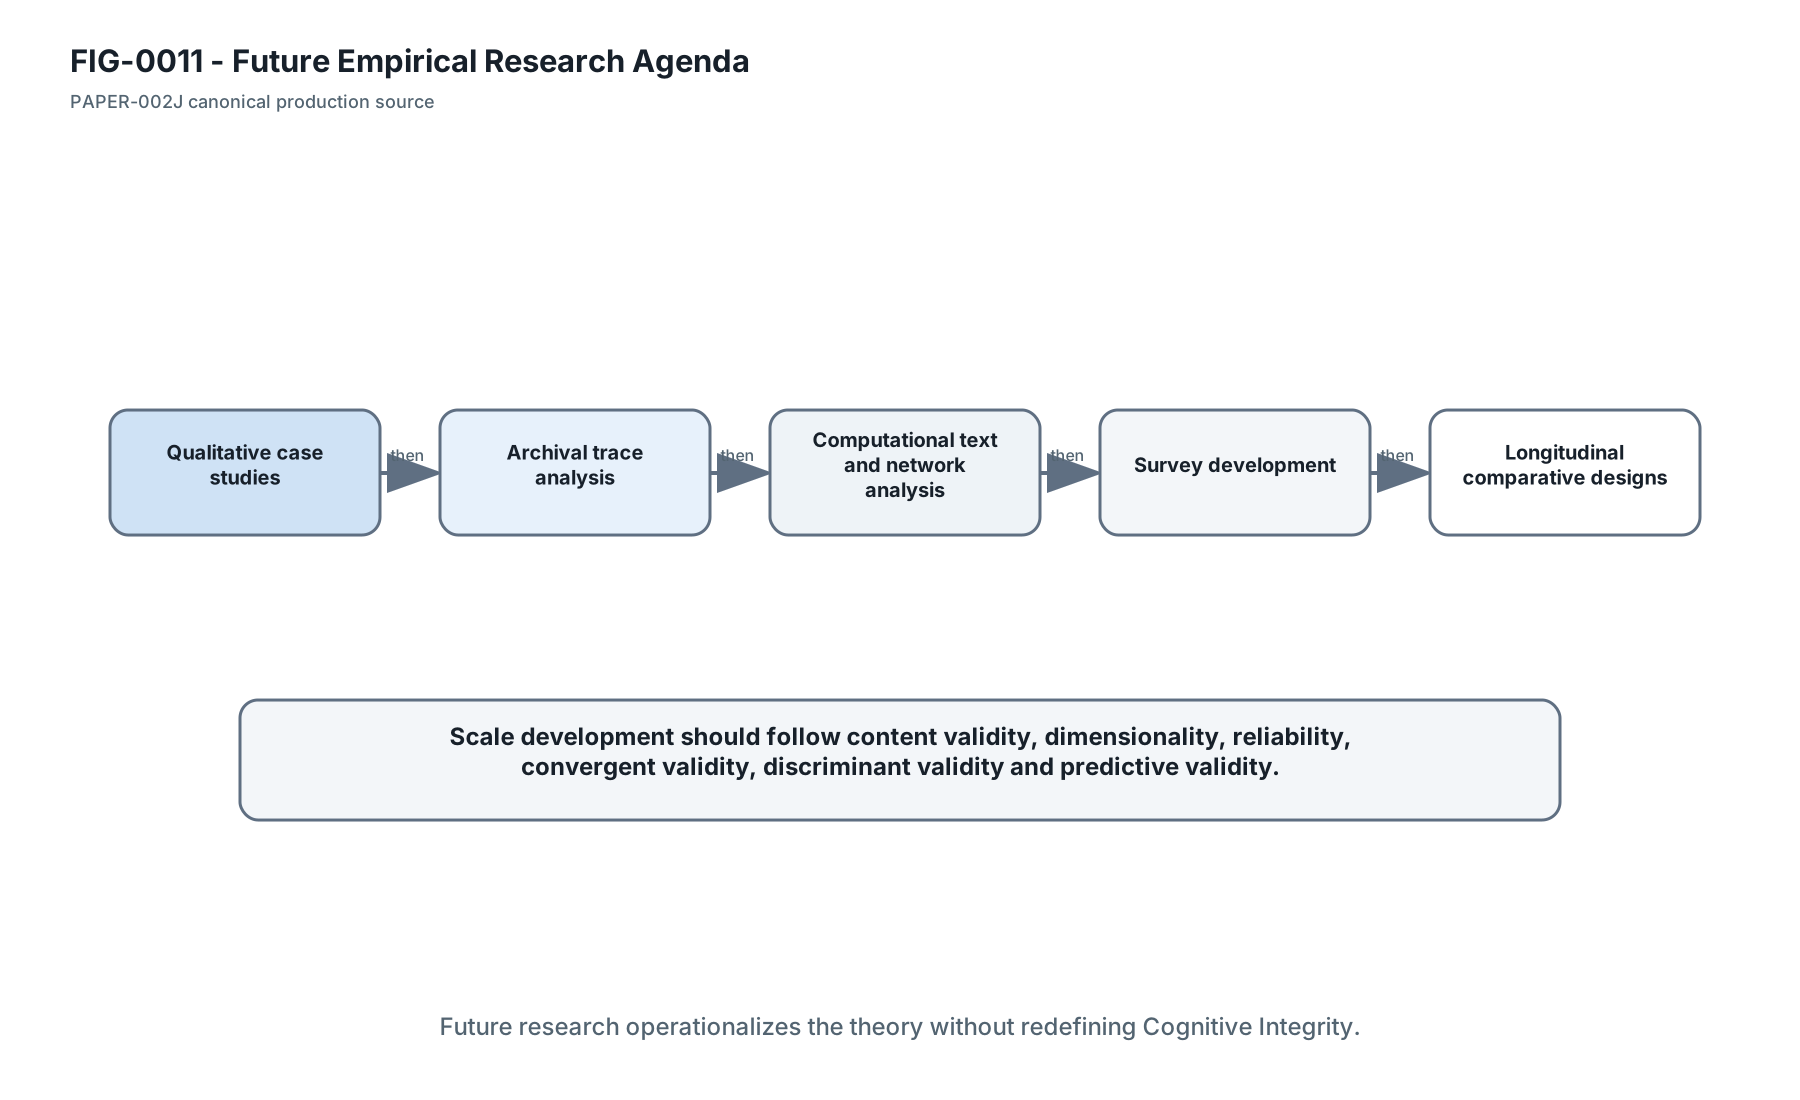
## Concise Alt Text Map future empirical work without claiming validation is complete. ## Extended Description The figure titled "Future Empirical Research Agenda" shows Case studies, Trace analysis, Text and network analysis, Survey development, Longitudinal comparative designs. It uses labelled shapes and arrows to show: Research methods build cumulatively toward validation.. ## Reading Order 1. Read the title. 2. Read the primary construct or role groups from left to right or top to bottom. 3. Follow solid arrows as primary relationships. 4. Follow dashed arrows as feedback, boundary, moderation or secondary relationships. 5. Read the lower note as the interpretive boundary. ## Construct Descriptions - Case studies - Trace analysis - Text and network analysis - Survey development - Longitudinal comparative designs ## Relationship Descriptions - Research methods build cumulatively toward validation. ## Encoding Limitations Color is supportive only. Meaning is preserved by labels, line styles, grouping, shape boundaries, captions and this accessibility description.
Figure 11 - Future Empirical Research Agenda. Figure 11 sequences future research from qualitative case studies through archival trace analysis, computational text and network analysis, survey development and longitudinal comparative designs.

Figure 12

Overall Correspondia Research Architecture

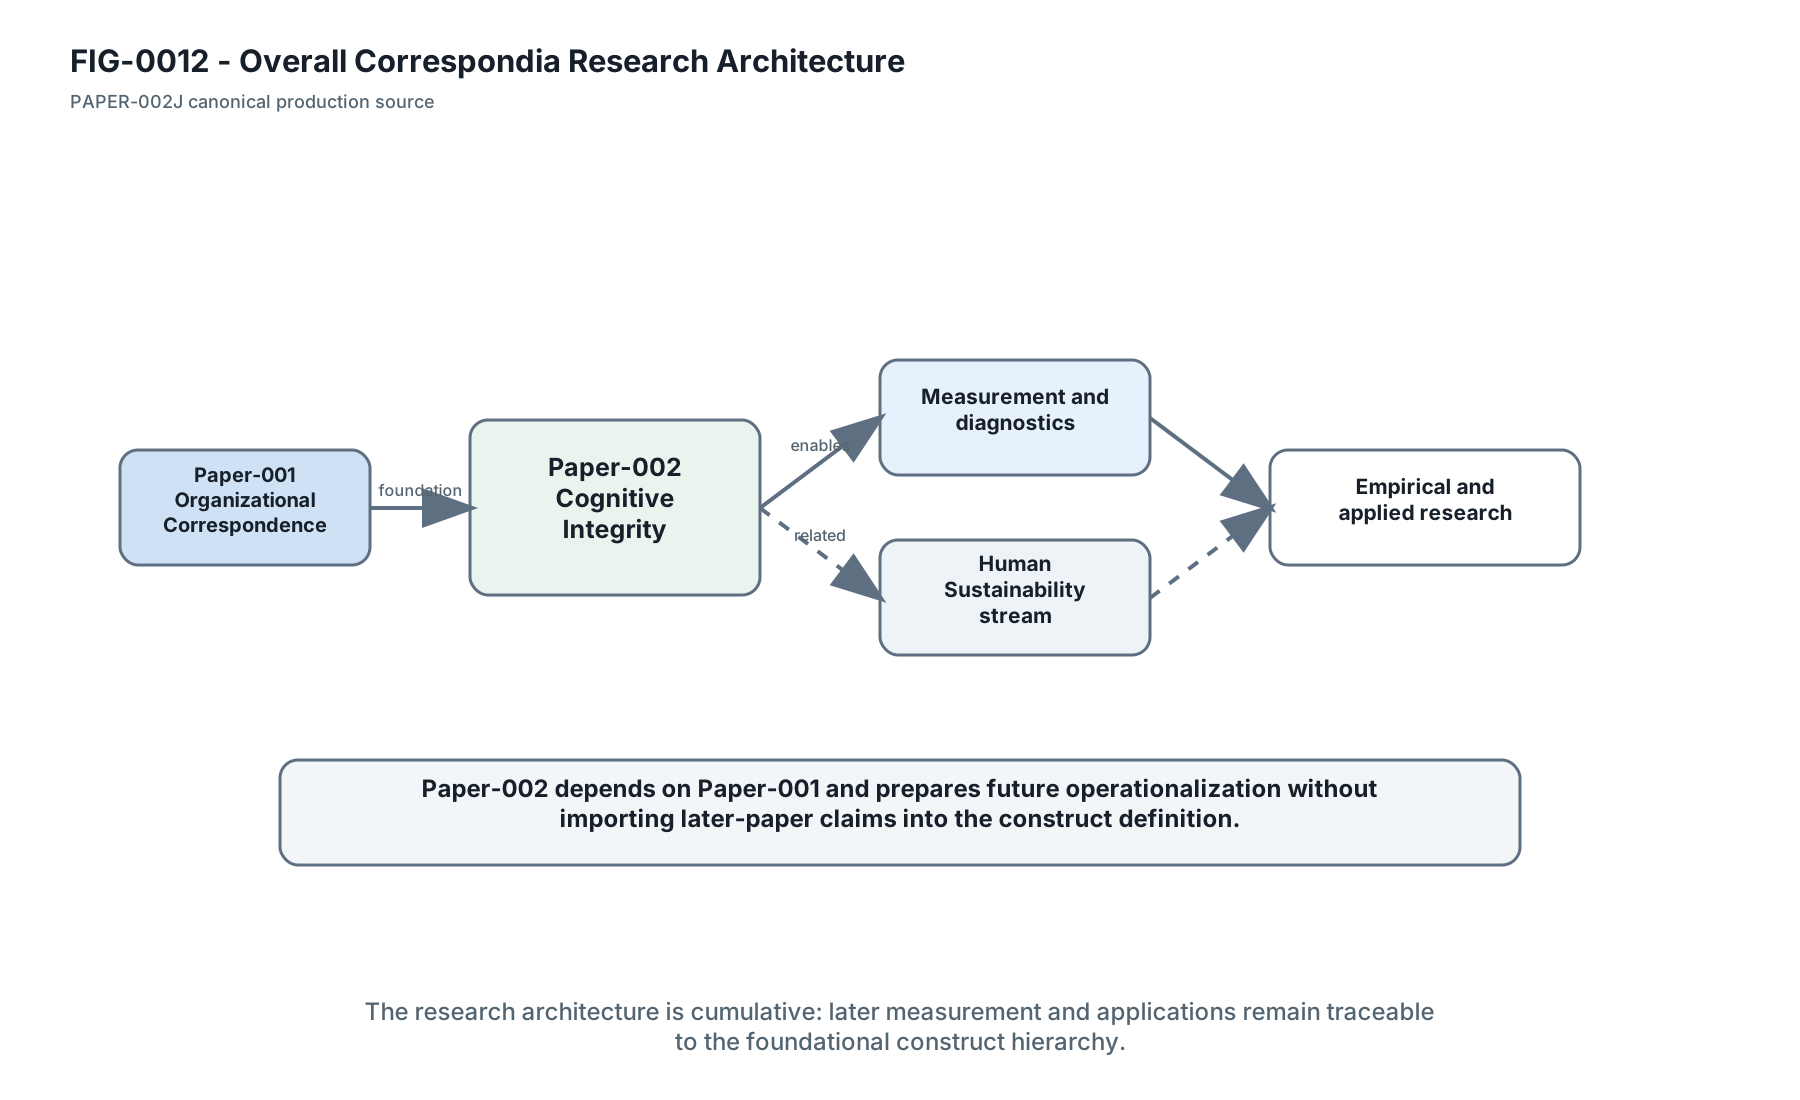
## Concise Alt Text Show Paper-002's place in the broader research architecture. ## Extended Description The figure titled "Overall Correspondia Research Architecture" shows Paper-001, Paper-002, Measurement, Human Sustainability, Empirical and applied research. It uses labelled shapes and arrows to show: Paper-002 depends on Paper-001 and enables later research streams.. ## Reading Order 1. Read the title. 2. Read the primary construct or role groups from left to right or top to bottom. 3. Follow solid arrows as primary relationships. 4. Follow dashed arrows as feedback, boundary, moderation or secondary relationships. 5. Read the lower note as the interpretive boundary. ## Construct Descriptions - Paper-001 - Paper-002 - Measurement - Human Sustainability - Empirical and applied research ## Relationship Descriptions - Paper-002 depends on Paper-001 and enables later research streams. ## Encoding Limitations Color is supportive only. Meaning is preserved by labels, line styles, grouping, shape boundaries, captions and this accessibility description.
Figure 12 - Overall Correspondia Research Architecture. Figure 12 positions Paper-002 within the Correspondia research architecture, depending on Paper-001 and preparing measurement, Human Sustainability, empirical and applied research.